High Rate |


| The Split-Hopkinson Pressure Bar (SHPB) technique complements the Laser Based High Rate Testing by providing a method for deformation at lower rates (102-104 /s). Unlike the LBHRT setup, the SHPB can be used for tensile and torsion testing as well as compression. We use the technique in combination with texture measurements and in-situ TEM microscopy to investigate the interaction of dislocations with twin and grain boundaries as plastic deformation proceeds in fcc and hcp metals. Specimens are deformed at high rates to varying plastic strains to generate twinned microstructures. Starting and final deformed textures are compared and can be used to determine the active deformation mechanisms. The deformed materials are prepared for in-situ TEM microscopy, with the hope that the resulting understanding of dislocation-boundary interactions can be used with field dislocation mechanics models to improve the predictive capability of plasticity codes. Figure 1 shows a schematic of the basic Hopkinson bar setup. It consists of two long cylindrical bars of the same diameter, called the incident and transmitted bars. In a compression test, the sample sits sandwiched between the incident and transmitted bars. A striker bar of the same diameter is propelled using a gas gun so that it strikes the incident bar squarely on the end. This generates a compression wave which travels down the incident bar. Part of the wave is reflected and part is transmitted through the interface with the specimen. The stress pulse continues through the specimen and into the transmitted bar. The incident stress pulse and transmitted stress pulse are measured in real-time using strain gages on the incident and transmitted bars. If the two bars remain elastic and wave dispersion ignored, then the measured stress pulses can be assumed to be the same ones acting on the sample.  Figure 1. Schematic of SHPB with x-t diagram showing the motion in time and 1D space of the compression pulse. Note that there is a loading and unloading portion of the wave marked as yellow and red arrows in the x-t diagram. The reflections of the wave inside the sample serve to homogenize the stress state during the test. The equations used to extract the stress-strain curve from a SHPB test follow from dynamic wave propagation theory. The strain rate is found directly from the strain in the incident bar caused by the reflected wave  : :
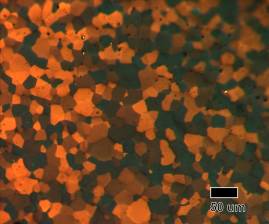
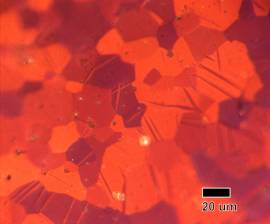
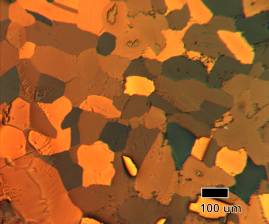
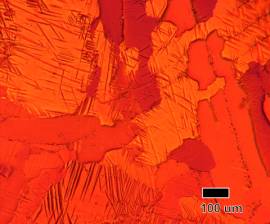
Figure 2 shows a representative oscilloscope trace and stress-strain curve generated using the compression SHPB. In the stress-strain curves on the right, notice that the red (3 wave) curve oscillates around the blue (1 wave) curve. This is because as the average of the stresses on the front and back face of the specimen, the 3 wave stress analysis provides information about how soon the actual stress state can be assumed homogeneous. In this tests, after approximately 3% strain. Three to four wave reflections is a standard approximation for stress homogenization.  Figure 2. Representative oscilloscope trace (left) showing the amplified strain gage output for the incident (red) and transmitted bars. Notice the reversal in sign of the reflected wave in the incident signal. The reflected wave is tensile, while the incident and transmitted waves are compressive. The stress-strain curves for the two types of analysis as well as the strain rate-strain curve (right). Some preliminary results for OFHC copper, 2024 aluminum and pure zirconium are shown in Figure 3-5. 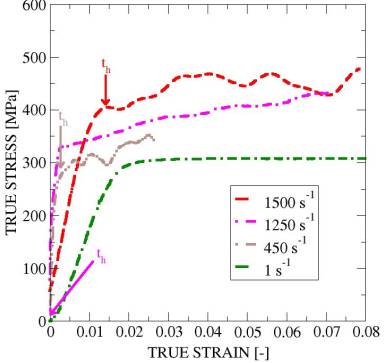 Figure 3. True Stress-Strain curves for polycrystalline copper at low, middle and high rates. th refers to the homogenization of the stress state in the sample. 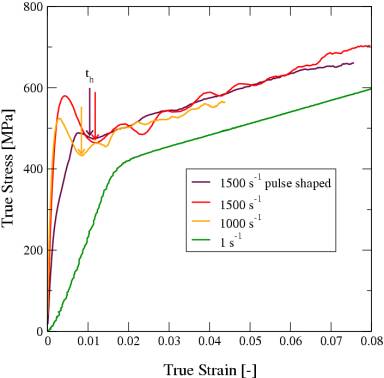 Figure 4. True Stress-Strain curves for 2024-T6 aluminum at three rates.  Figure 5. True Stress-Strain curves for pure zirconium at several higher rates. Figures 6 and 7 show optical micrographs of pure zirconium which have been deformed on the Hopkinson bar. The sample in Figure 6 started as a small grained sample, and was deformed to just 5% strain at a moderate rate of 600/s. The sample shown in Figure 7 was a larger grain sample that was deformed to 9% strain but a higher rate of 1200/s.
| ||||||||||||||||||||